Input data format
The input file can be of many types as long as it can be converted to a data.frame containing a number of columns with protein intensities and one column with protein identifiers. A protein identifier correspond to a unique entry in the UniProt database. Multiple protein identifiers can be associated with a single protein group.
Preprocessing data
By default InteRact() performs several preprocessing steps using the function preprocess_data(). Data preprocessing consists of:
- Selecting intensity columns matching
condition$columns(see Metadata) - Discarding experimental conditions, biological or technical replicates flagged by parameters
filter_time,filter_bioorfilter_tech - Discarding columns that could not be converted to numeric
- (optionnal) Filtering protein groups with a sub-threshold score (in column
Column_score) or with no gene name associated (in columnColumn_gene_name) - Merging protein groups with the same gene name
- Discard proteins with NA values for all conditions
- Normalize on median intensity across conditions
- Averaging protein intensities over technical replicates
preprocessed_data <- preprocess_data(proteinGroups_Cbl,
                            Column_gene_name = "Gene.names",
                            Column_score = "Score",
                            Column_ID = "Protein.IDs",
                            Column_Npep = NULL,
                            Column_intensity_pattern = "^Intensity.",
                            bait_gene_name = "Cbl",
                            condition = NULL,
                            bckg_bait = "Cbl",
                            bckg_ctrl = "WT")
## Contaminant proteins discarded
## Proteins with no gene name available discarded
## Number of theoretically observable peptides unavailable : used MW instead
## Merge protein groups associated to the same gene name (sum of intensities)
## Rescale median intensity across conditionsNote that if the data.frame condition is not specified, conditions will be mapped to intensity columns automatically using identify_conditions() (see Metadata).
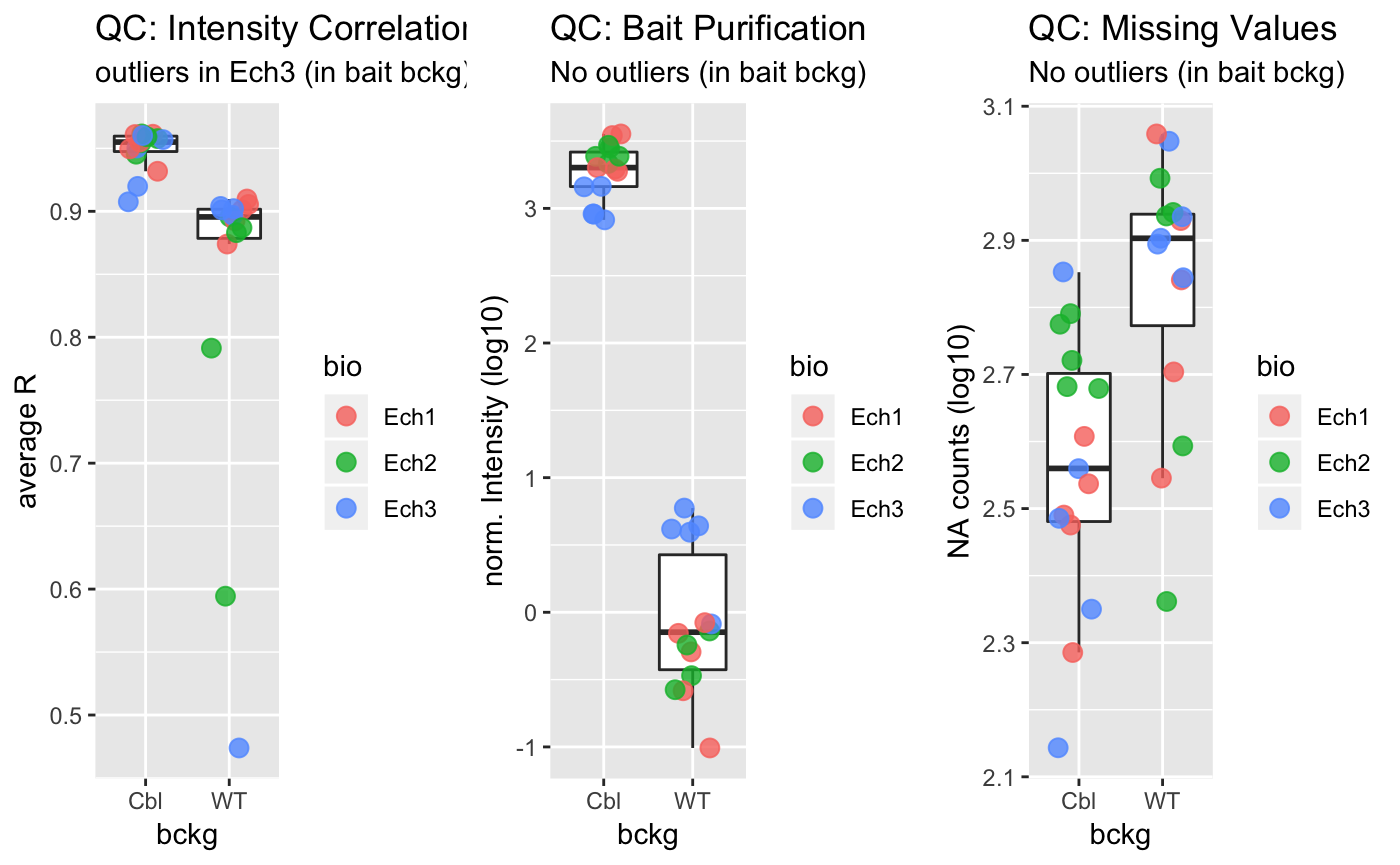
Quality Check
Following preprocessing, data quality can be as assessed using several functions. You can assess the distribution of missing values, the correlations in protein intensities between samples, the quality of affinity purification using plot_QC():
library(gridExtra)
grobs <- plot_QC(preprocessed_data)$plot
grid.arrange(grobs = grobs, nrow = 1)